Windows Batch File Editing and Debugging
Are you a Windows developer, admin, operations, tech support professional, or advanced user involved with script programming, debugging, and / or execution? Are you frustrated with the limitations of CMD batch file commands? Do you yearn for a real scripting language and an integrated IDE?
Creating batch files in Windows has always been tedious (and painful for non-trivial scripts). Windows provides very little support for creating batch files, and none at all for debugging them. Most people are resigned to using the crude and inefficient (or non-existent!) tools provided with Windows when creating and debugging their Windows batch files.
But creating batch files doesn’t have to be frustrating. Take Command is the ideal solution to your CMD batch files woes.
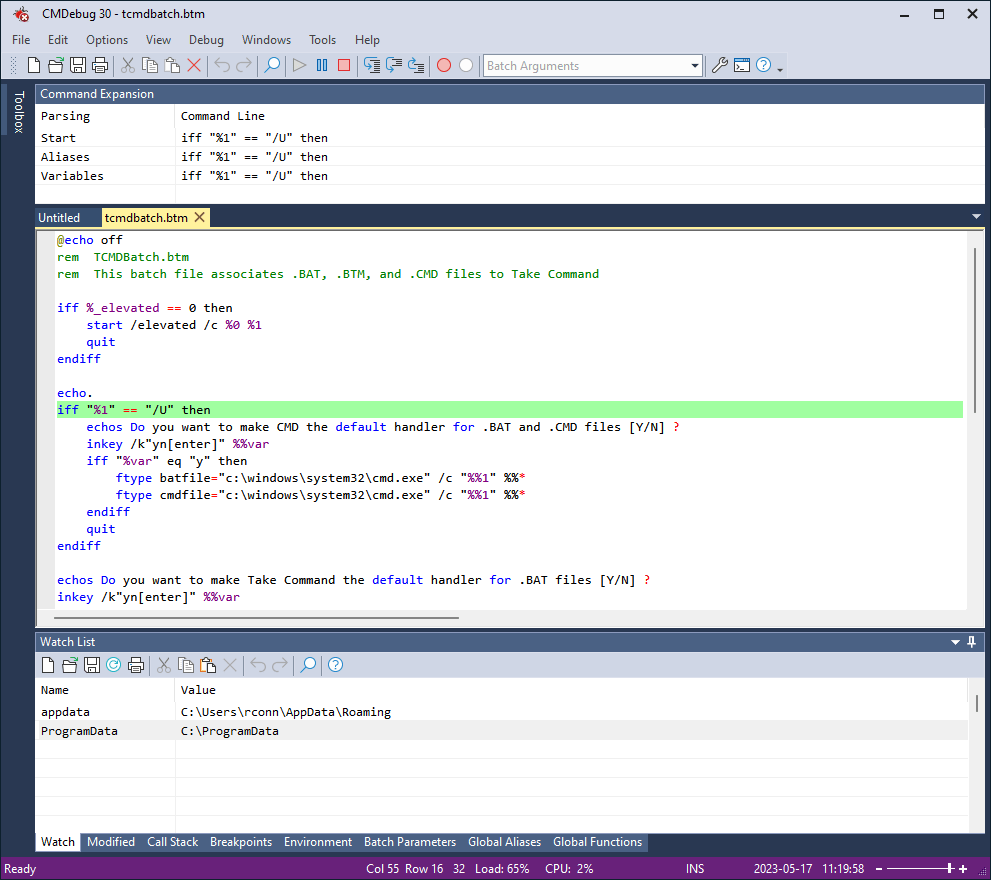
Take Command includes a very powerful IDE (Integrated Development Environment) for creating, editing, and debugging batch files. The IDE includes tabbed edit windows and a sophisticated debugger with single stepping, breakpoints, tooltips, bookmarks, and tabbed variable and watch windows. The IDE also includes syntax coloring for batch files (.BAT, .CMD, and .BTM) and code folding for command groups and the TCC DO, IFF, SWITCH, and TEXT commands.
Windows batch file programming has never been easier or more powerful!
You can use the IDE to develop either CMD-compatible batch files, or TCC-compatible scripts. If you select the "TCC Syntax" option, the IDE supports the full TCC command set. If you select the "CMD Syntax" option, the IDE will disable TCC-only internal commands, variables, and functions. Some internal CMD / TCC commands will also behave slightly differently or modify their display output in order to match CMD's behavior more closely.
The IDE editor will display document changes in the margin and in the text. In the text, inserted characters appear with colored underlines and points where characters were deleted are shown with small triangles. The margin shows a block indicating the overall state of the line.
The debugger has a host of additional features, including:
- The Command Expansion window will show the original command line, the command line after alias expansion, and the command line after variable expansion.
- You can set breakpoints, and optionally define a condition before the breakpoint is triggered.
- You can enter variables you want to monitor in the Watch tab window.
- The “Modified” tab shows the current value and the previous value of the variable that was just changed.
- The Call Stack tab displays the current call stack (the filename, line #, command line, and the line(s) that called it (i.e., GOSUB or CALL).
- The IDE supports ANSI, UTF-8, UTF-8 w/BOM, and UTF-16 files.
- When debugging, the IDE window will now keep the current line centered on the screen (unless it’s on the last page). This allows you to see both the last few lines and the next ones to be executed.
- The edit window will default to maintaining the same indentation as the previous line.
- The debugger has a profiler to help optimize your batch files. The resolution is in milliseconds (.001 seconds) ).
- If you’re using TCC syntax (not CMD), and the first command on the line is an internal TCC command, the IDE will display the quick usage help on the status bar.
- The Regular Expression Analyzer has a “cheat sheet” of RE syntax and common expressions.
-
There is a "RegEx Filter" combobox on the toolbar. If you enter a string in the filter box, the debugger will hide all non-matching lines in the current tab window.
